
Building a Decline Set
Introduction

Click image to expand or minimize.

Click image to expand or minimize.

Click image to expand or minimize.
Within the Production Tab, after selecting the well, to add a decline for any product, select the product(s) to add. This will open up a further section for the product (oil, gas, water, etc.) that will allow you to put in the data for the decline.

Click image to expand or minimize.
Within the decline tab, the inputs are organized within the context of a Production Set which stores the production forecast for each product. There exists the capability to specify one of these sets as the default that will be chosen in the absence of any other inputs and from 2.14 this default can now be swapped. This adjustment could be performed by either manually changing the active set within this screen or specifying within the well list which set is to be used.
.gif)
GIF demonstration. Click image to expand or minimize.
The Decline tab or dialog will allow you to choose the type of production forecast to use and insert the associated data. The forecast method can be either Decline (the default), Ratio(Cum), Ratio(Time), Array(Time), Array(Cum), or Function. If we choose Decline or Ratio(Cum) / Ratio(Time), a predetermined analytic form is implied. We select the method (Exponential, Hyperbolic, Harmonic, Linear, or Flat for a Decline; Semi-log or Linear for a Ratio) and then enter the appropriate parameters.
Production Forecasts can also be entered as array data. Array(Time) and Array(Cum) are similar but not identical instruments, though we often make this simplification reducing the differences to the format of the input data. Array(Time) use Rate-Time curves with the criteria of:
- Are designed to work through periods of zero production which is not possible for Rate-Cum curves inputted as Array(Cum) as it cannot work through such a period as it would not be advancing on the cum curve
- Are not coordinated to a single primary product like Rate-Cum curves
- All product curves must move together in-sync as per their non-curtailed input curves.
As a result of this criteria, when using Array(Time) inputs the multiple product curves must move forward at a single curtailment factor even if there is no single percentage factor that can be applied that would produce say 50% of the gas and 50% of the water. Thus the key difference is that Array(Time) are calculated on a Cum Days basis not a Cum Production basis with deltas between Cum Days and Cum Production covered in subsequent months as extra or negative production.
Refer Using a Type Well for more details on inputting Arrays.
The Function option allows a completely free entry of any allowed calculation that can be constructed with Enersight’s Function Builder (see Function Reference Library ). In the spirit of the type curve approach, this is more likely to remain rate vs cumulative but the cumulative may not necessarily be for the primary product. For example, water oil ratio of an oil well might depend on cumulative water injection instead of, or in addition to cumulative oil production.
Taking a hyperbolic decline as an example, you would select the forecast method as Decline and decline method as Hyperbolic, whereby the appropriate parameters would appear.
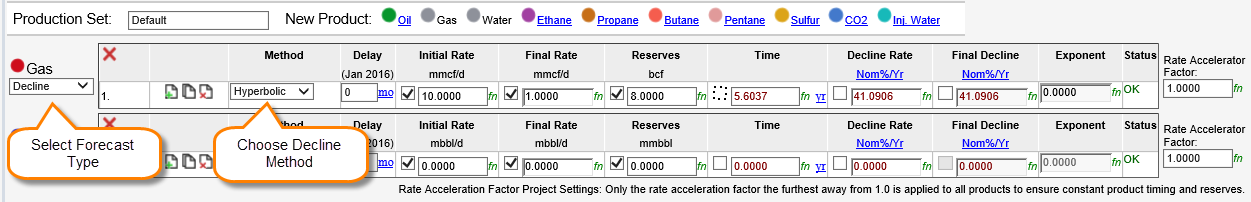
Various combinations of three parameters can be used to complete the definition. Check the box for parameters that you wish to specify, and Enersight will calculate the others. User input values are black, while calculated values show up as dark red.

Click image to expand or minimize.
Each Product Forecast may finally be made up of Multiple Segments.